BISM / MODEL

Inside the BISM model

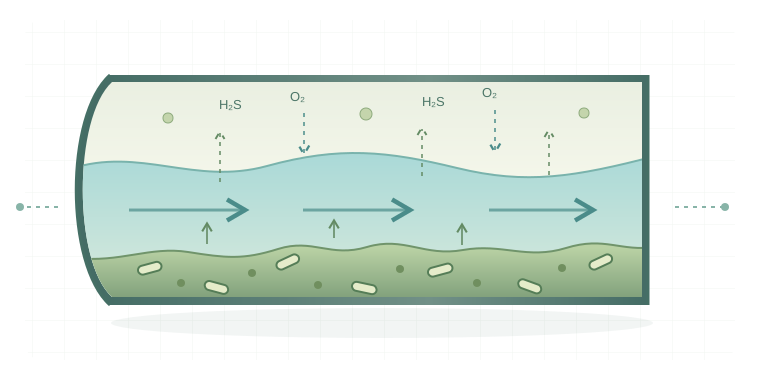
Connect water quality along the flow path, processes inside the biofilm and exchange with sewer air.

Conceptual sewer cross-section showing wastewater flow, wall biofilm and H₂S and oxygen exchange.
Wastewater quality modelDynamic biofilm modelGas exchange model
WHY BISM

Understand the source. Follow the risk

Understanding changing microbial processes is the starting point for sustainable sewer control strategies.

Why do sewers produce H₂S?

As wastewater remains in a pipe, oxygen is consumed and oxygen-depleted zones develop inside the wall biofilm. SRB use organic matter to reduce sulfate to sulfide. Under acidic conditions, sulfide forms H₂S that escapes into sewer air. H₂S causes odor and can be oxidized to sulfuric acid on concrete surfaces, causing corrosion.

Why use a dynamic model?

Biofilms grow, detach and recover. After biocide dosing or flushing, SRB may regrow within days to a couple of weeks. BISM focuses on this rebound time to assess how long an intervention remains effective and when further control is needed.

What makes BISM different?

A dynamic biofilm core couples gas, water and biofilm processes, extending immediate water quality predictions to long-term odor control assessment. BISM supports gravity and pressure sewers with circular or rectangular cross-sections.

MODEL CORE

Three submodels. One coupled system

Connect water quality along the flow path, processes inside the biofilm and exchange with sewer air.

Wastewater quality model

Tracks dynamic concentrations of sulfide, sulfate, ammonium and organic matter as wastewater moves through the sewer.

Dynamic biofilm model

Divides the wall biofilm into thin layers to simulate growth, competition, attachment and detachment of SRB, heterotrophs and other organisms at different depths.

Gas exchange model

Calculates H₂S transfer from water to air and oxygen reaeration to assess the risk of H₂S release.

FIG. 02BISM spatial discretization, gas–water–biofilm transport and biochemical reaction matrix: 22 biochemical processes, 7 soluble and 7 particulate variables.Click to view in high resolution
FIG. 02
BISM spatial discretization, gas–water–biofilm transport and biochemical reaction matrix: 22 biochemical processes, 7 soluble and 7 particulate variables.

BISM spatial discretization, gas–water–biofilm transport and biochemical reaction matrix: 22 biochemical processes, 7 soluble and 7 particulate variables.

CALIBRATION & VALIDATION

Dynamic predictions tested against observations

Calibration and validation use observations from separate stages to compare dissolved sulfide over time. These comparisons support sulfide prediction and odor mitigation assessment in large-scale pressurized sewers.

Related publication · Water Research, 2019 ↗
FIG. 05Calibration and validation of dissolved sulfide: lines show simulations and open circles show measurements, with Stage 1 and Stage 2 distinguished in the legend.Click to view in high resolution
FIG. 05
Calibration and validation of dissolved sulfide: lines show simulations and open circles show measurements, with Stage 1 and Stage 2 distinguished in the legend.

Calibration and validation of dissolved sulfide: lines show simulations and open circles show measurements, with Stage 1 and Stage 2 distinguished in the legend.